


How to Do Forecasting in Power BI (Steps & Accuracy Metrics)
Remember our last guide - Power BI forecasting? It revealed things that truly blocks accuracy, both structural and situational. Now it's time to take the next step. Knowing Power...

601 & 612, The Times square Arcade, Near Baghban party plot, Thaltej - Shilaj Road, Thaltej, Ahmedabad, Gujarat - 380059
We are dedicated to delivering top-notch Dashboard Development services tailored to your unique business requirements. Our expertise ensures the creation of intuitive and dynamic dashboards that turn your data into actionable insights. Let's collaborate to develop dashboards that drive informed decision-making and enhance your business performance.
 Industry-focused expertise Certified Microsoft Power BI expertTop-tier data security Complex data modeling expert Fully Executed NDA Client-centric approach Flexible engagement options Industry-standard Compliance


Years of Technology Experience
Success Ratio
Creative nerds under one Roof
Projects Delivered
(Empowering industries with data-driven visuals)

To make great decisions, it's important to understand complex data and turn it into simple visuals, which we call data stories.
Our team has extensive experience in doing this and based on your industry needs we help you learn various scenarios, uncover insights, and identify solutions to know where your business is falling short.
We use software services, connectors, Power BI data modeling, and data pipeline tools to develop dynamic dashboards that showcase insights you can act on.
Let us take care of your tech so you can focus on what’s important in your business. Partner with us for data analytics and visualization services.
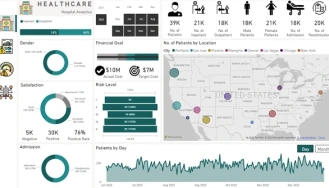
As a Microsoft Solutions Partner, we go beyond that by being experts in Power BI consulting services. We offer interactive Power BI visualization services tailored to any industry, including healthcare, legal, and fintech.
Our dashboard development services help you display actionable insights turned from the raw data scattered from diverse sources, making decision-making very easy.
Here are the highlights:
We bring together a team of vetted Data visualization specialists who understand the complexities of dashboard design and functionality, ensuring top-notch results every time.
We have a deep understanding of various industries, we design customized dashboards to meet the unique needs of your niche, providing you with relevant and meaningful insights.
Power BI development using Agile processes involves iterative and incremental development cycles. We use this approach to enable continuous feedback, quick adjustments, and regular updates, ensuring that the Power BI solutions built by our data visualization experts are always aligned with your business needs.
See the bigger picture of your business with our expert dashboard development services. Our business intelligence solutions help you turn your diverse data into actionable insights. Let’s walk through our BI dashboard development and consulting services.
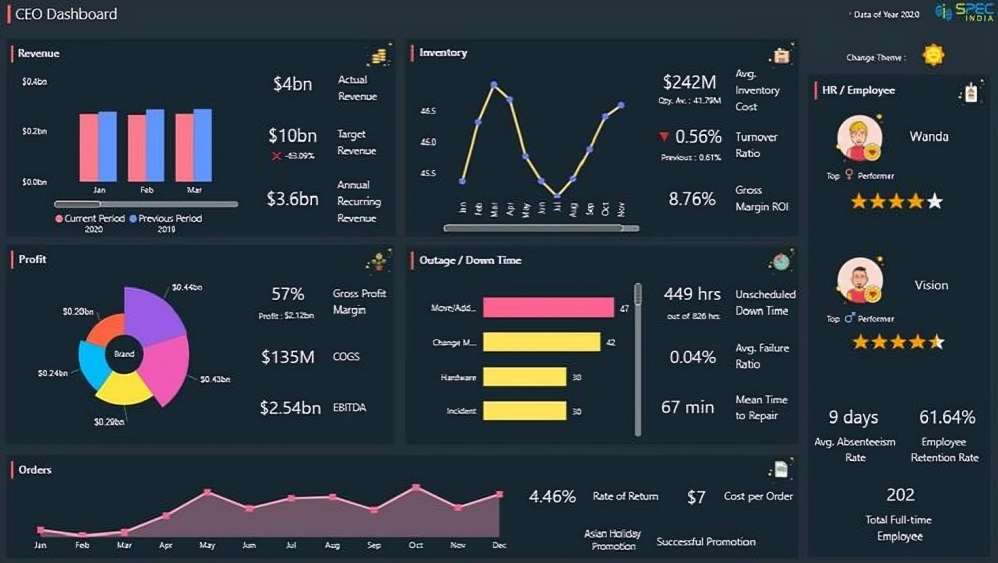
We create strategic dashboards that allow leadership to make informed and impactful decisions. Here is how our dashboards cater to key roles:
It is designed to provide a 360-degree view of the organization's performance, which help CEOs to track key metrics, spot trends, and lead the company toward success.
A complete tool for board members to review high-level business data, assess progress on strategic initiatives, and align decisions with enterprise goals.
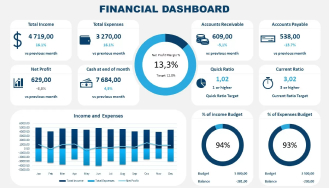
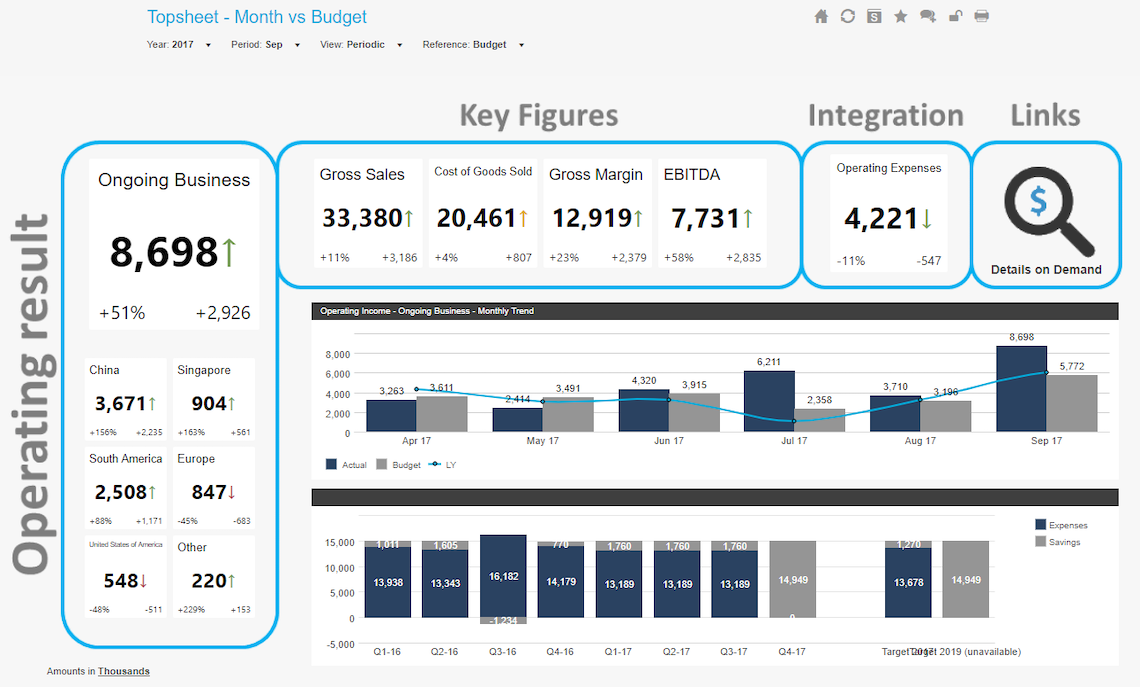
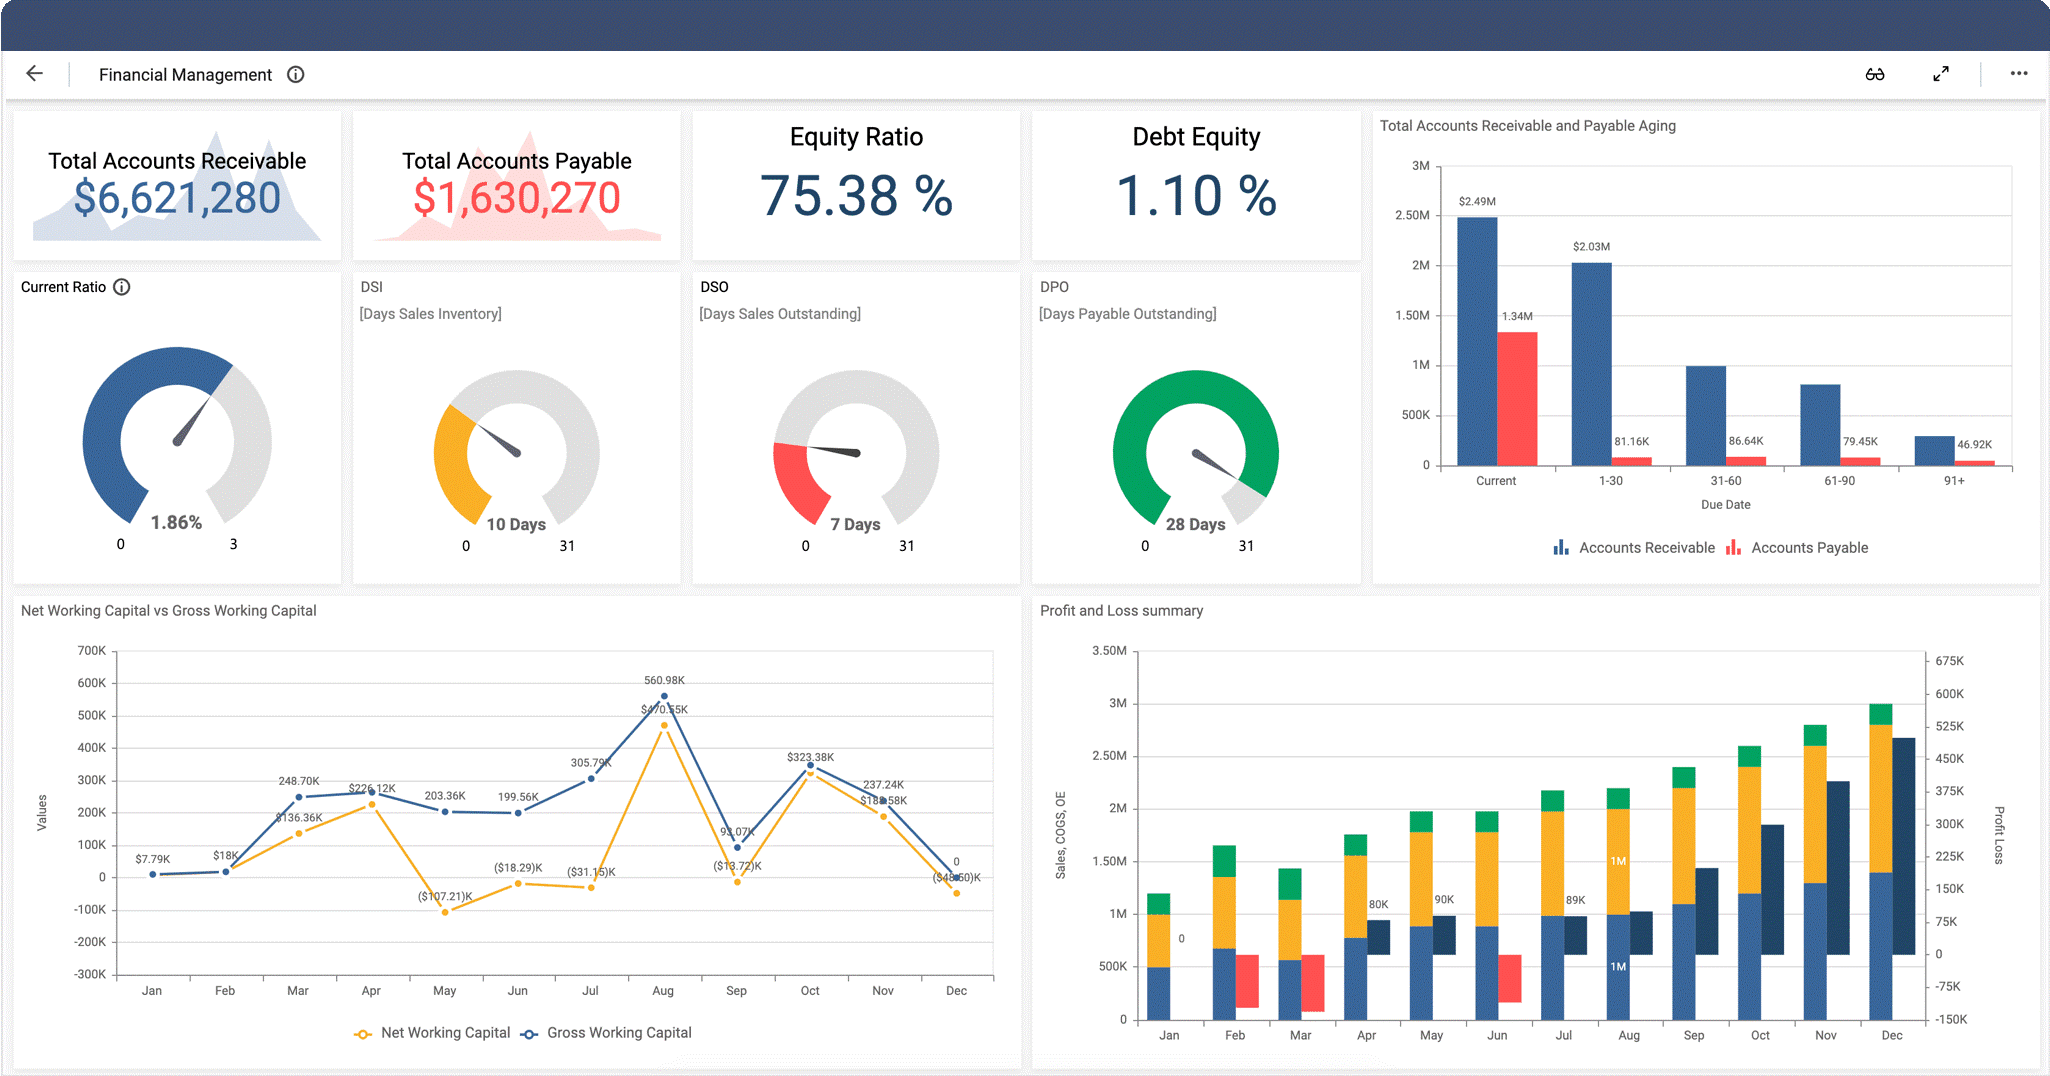
Focused on financial health, this dashboard delivers critical insights into cash flow, budgeting, forecasting, Management Accounting and overall financial performance easily.
It Helps business leaders to track opportunities, analyze market data, and assess progress on expansion goals, making it easier to focus on expandable growth.
It is a powerful tool to track key sustainability metrics like environmental impact and social responsibility efforts, helping organizations lead with purpose and accountability.
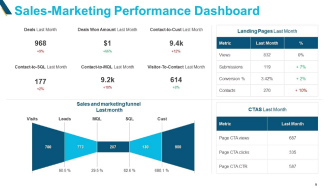
With iFour, marketing teams can easily track campaign performance, engagement, and ROI for paid marketing initiatives. This dashboard helps to strategies and target the right audience that maximize marketing efforts for optimal results.
iFour makes the data scientists dashboard by providing the tools to analyze large datasets, spot trends, and create predictive models. It transforms complex data into valuable insights that add values
We help you visualize customers’ actions, analyze behavior, preferences, and satisfaction levels to assist you in taking a custom approach to improve customer experience.
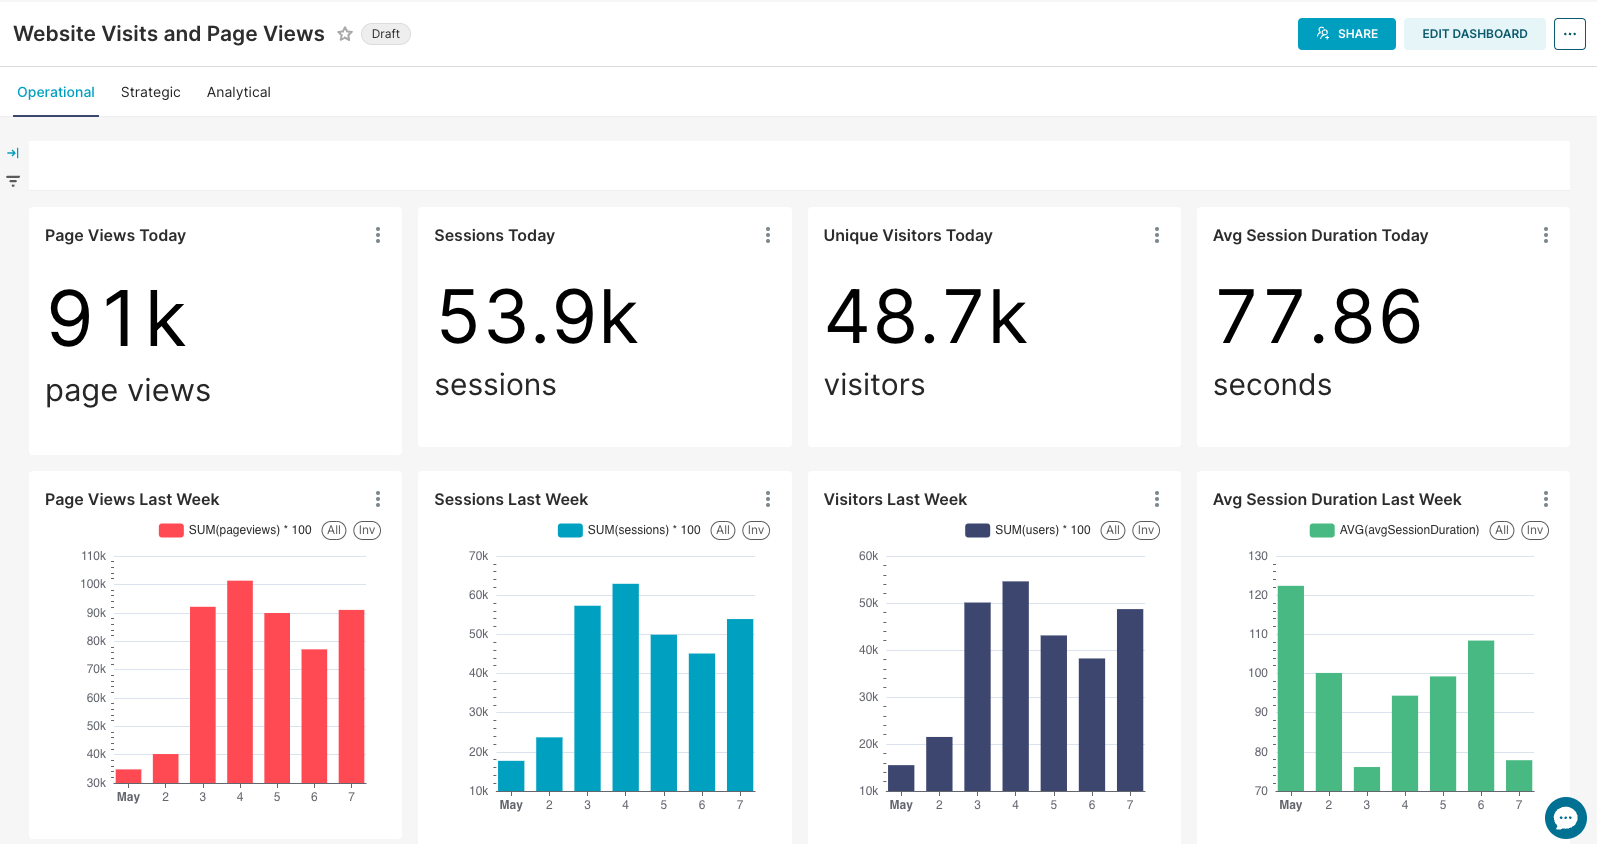
It tracks key metrics like product sales, user engagement, and customer feedback in real time. This dashboard helps you make data-driven decisions to optimize product performance and profitability.
This dashboard makes it easy to track employee productivity, goals, and performance metrics. And promotes accountability, aligns team goals with business objectives.
This Chief Operating Officers dashboard shares a complete overview of operational performance, helping them track efficiency and drive improvements across the organization.
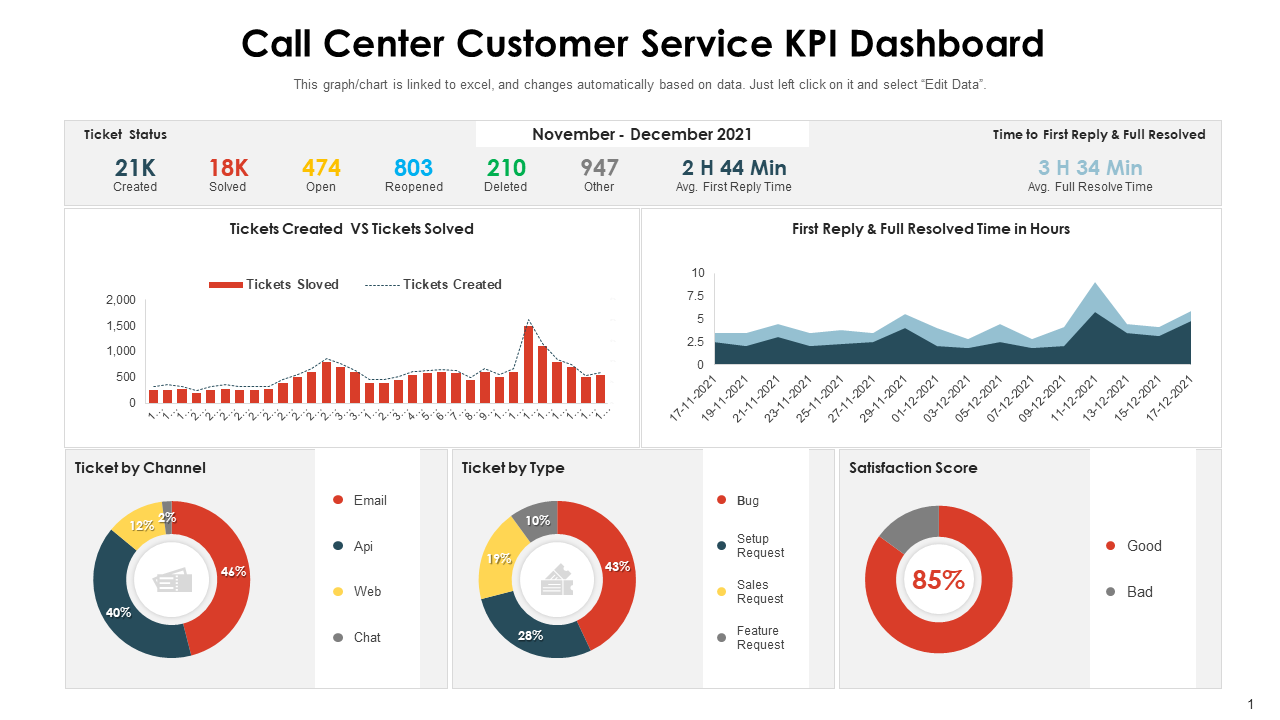
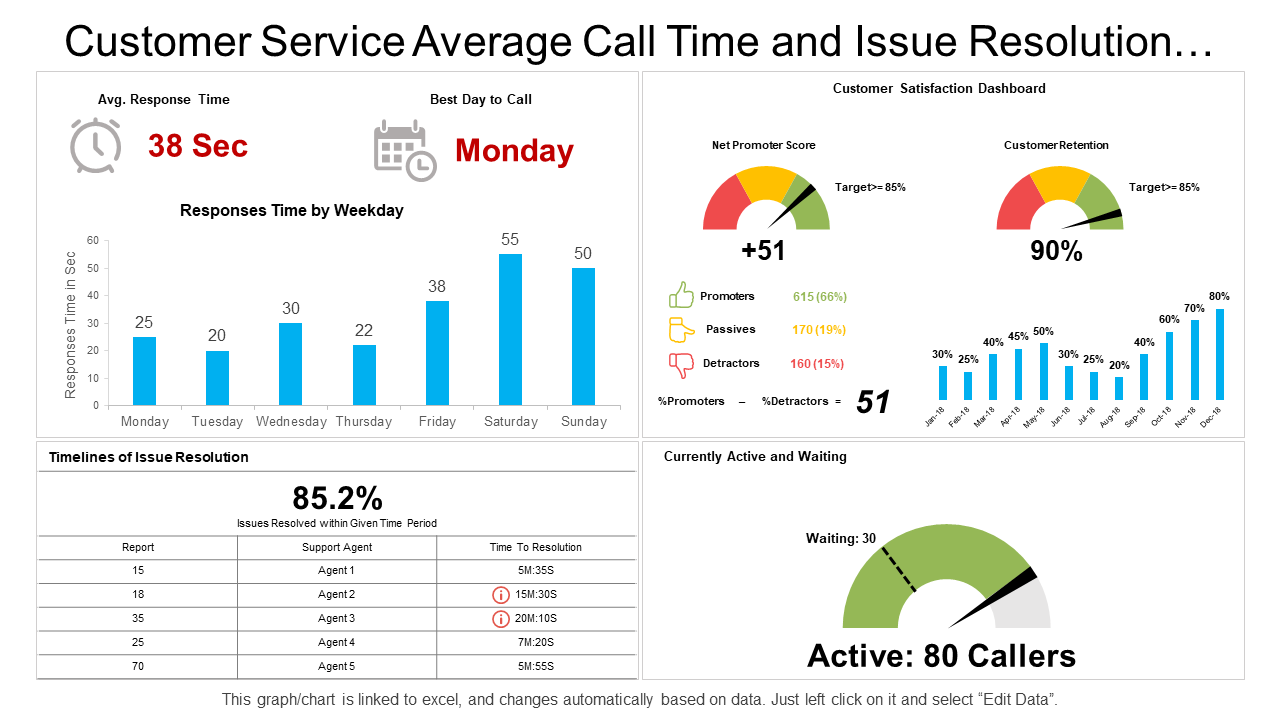
This dashboard keeps track of ticket resolution times, customer satisfaction scores, and team performance metrics with custom KPIs. It helps identify bottlenecks, improve response times, and ensure exciting support experience that makes the customer experience better.
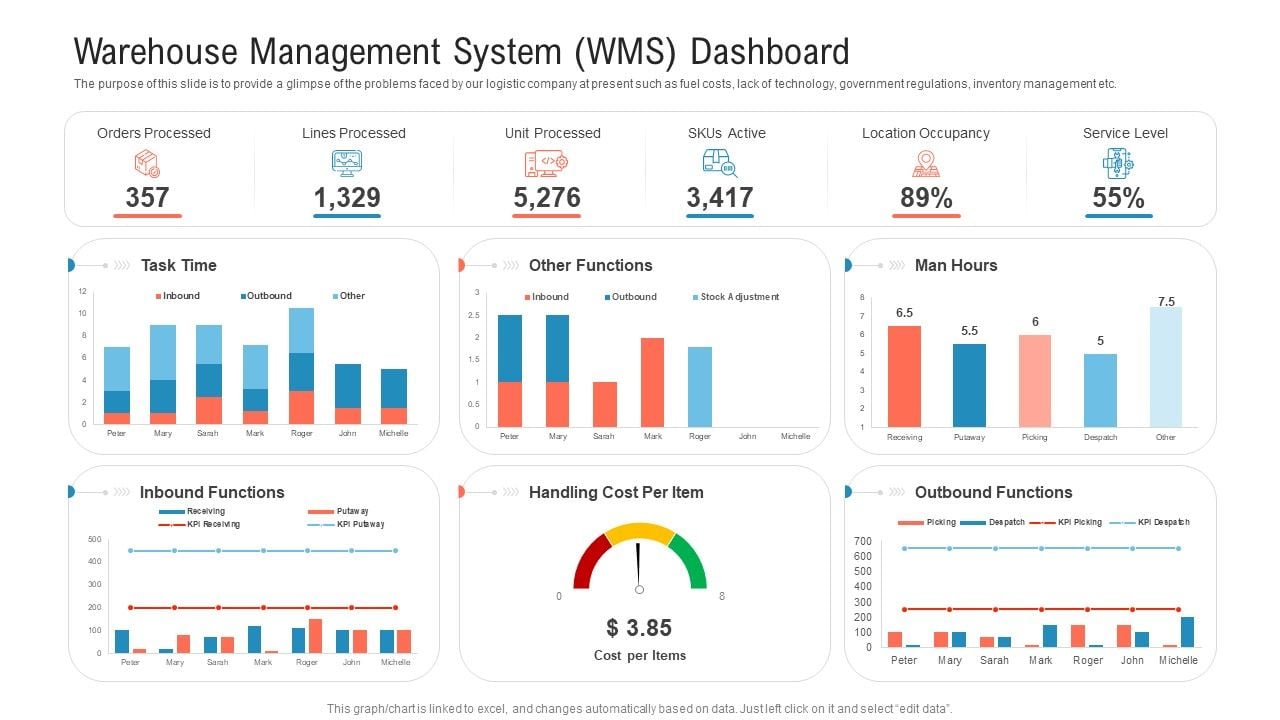
This dashboard provides real time insights into inventory levels, order fulfillment status, and shipping accuracy. It helps to streamline operations, minimize errors, and ensure timely deliveries.
Aiming to keep IT teams updated on system performance, uptime, and issue resolution. It helps IT teams stay proactive, quickly address problems, and ensure systems run smoothly without interruptions.
Provides insights into sales pipelines, team productivity, and revenue targets, helping managers stay on top of performance and growth.
Our tactical dashboards are designed to help managers at all levels optimize their day-to-day activities at granular level and ensure smooth operations.
Track project progress, resource allocation, timelines, and budget in one place. This dashboard helps project managers stay on top of tasks, identify risks early, and keep projects on track.
This dashboard helps to Monitor the performance of marketing campaigns in real-time, including leads, conversions, and engagement metrics. It enables campaign managers to make quick adjustments for better outcomes.
Manage workforce data like employee attendance, performance, retention, and engagement. This dashboard helps HR teams optimize talent management strategies and improve overall organizational performance.
By Tracking sales, inventory, and customer feedback across multiple locations this dashboard can be used to optimize store operations, improve customer satisfaction, and drive sales.
This dashboard helps procurement managers streamline processes, reduce costs, and maintain supply chain efficiency by Monitoring supplier performance, order status, and inventory levels.
No matter what types of BI dashboards you require, we are here to assist you in all the ways possible.
Ours is a structured approach that ensures delivery of dashboards meets your business needs.
Here’s how we make it happen:
Requirement Analysis and KPI Identification
We begin by understanding the goals and identifying the key performance indicators (KPIs) that matter most to your business. This helps us create a solution to your specific needs.
Our team integrates data from multiple sources and creates data models to ensure accurate, real-time insights. This step ensures the dashboards are built on a solid foundation.
We design intuitive, visually appealing dashboards that are easy to navigate. Customization options allow us to align the dashboards with unique brand identity and user requirements.
Before deployment, we test the dashboards to ensure they work appropriately. Our continuous support and updates ensure the dashboards perform at their best after the launch.
Interactive and User-Friendly Interfaces:
It is designed for simple use, these dashboards allow users to easily explore data, drill into specifics, and gain insights effortlessly.
Our dashboard gets the latest information with real-time updates, complemented by visualizations to meet specific business requirements.
Ensure data security with role-based access, granting permissions only to authorized users.
Accessible on desktops, tablets, and mobile devices, the dashboards provide flexibility to manage and monitor data from anywhere.


![]()


Project Sign-off


The time to develop a dashboard depends on complexity, typically ranging from a few days to a few weeks.
Yes, dashboards can be easily integrated with existing systems to pull data and provide real-time insights.
To hire dashboard developers from iFour, simply contact us through our website or reach out to our email.
Yes, we sign NDAs with our resources to ensure the confidentiality and security of your data and projects. Get in touch with us to hire Power BI developers.
")
Remember our last guide - Power BI forecasting? It revealed things that truly blocks accuracy, both structural and situational. Now it's time to take the next step. Knowing Power...

Security has always been a major concern. Your company spends millions on cybersecurity tools, and guess what? You’re still vulnerable. When you're working in the cloud, especially...

Automation isn’t just a trend anymore. It’s a must-have for any business relying on the Cloud. As the firm grows, cloud infrastructure gets more complex. So, choosing the right Infrastructure...
